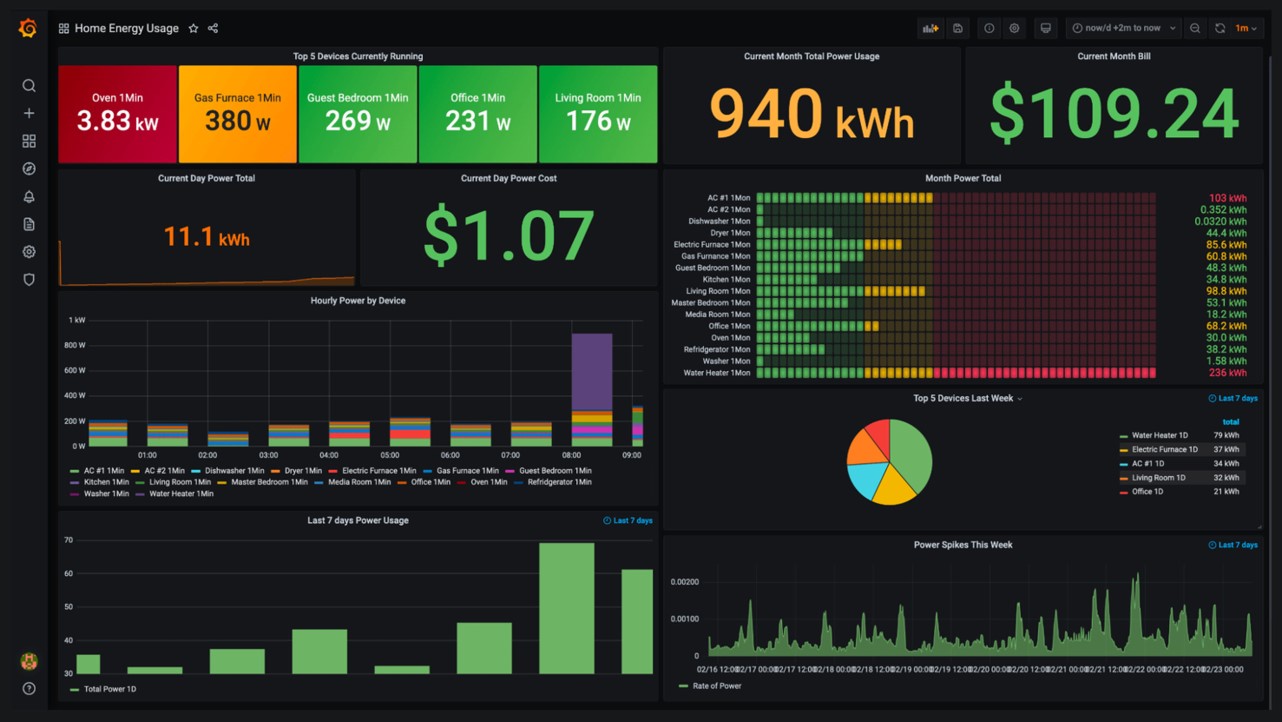
Grafana is a multi-platform open source analytics and interactive visualization web application. It provides charts, graphs, and alerts for the web when connected to supported data sources.
Unify your data, not your database – Grafana doesn’t require you to ingest data to a backend store or vendor database. Instead, Grafana takes a unique approach to providing a “single-pane-of-glass” by unifying your existing data, wherever it lives.
Data everyone can see – Grafana was built on the principle that data should be accessible to everyone in your organization, not just the single Ops person.
Dashboards that anyone can use – Not only do Grafana dashboards give insightful meaning to data collected from numerous sources, but you can also share the dashboards you create with other team members, allowing you to explore the data together.
Flexibility and versatility – Translate and transform any of your data into flexible and versatile dashboards. Unlike other tools, Grafana allows you to build dashboards specifically for you and your team.
References
https://grafana.com/
https://play.grafana.org/
What we are going to do ?
¡Spin an AWS EC2 instance with Ubuntu 20.04
Open ports for external access 80/443
Install grafana
Install Ngix Reverse proxy

Installing grafana on ubunutu 20.04 server

#Update ubuntu

sudo apt-get update -y

#Install necessary pacakges

sudo apt-get install wget curl gnupg2 apt-transport-https software-properties-common -y

#Add gpg key
wget -q -O - https://packages.grafana.com/gpg.key | sudo apt-key add -

#updo repo list of ubuntu

echo "deb https://packages.grafana.com/oss/deb stable main" | sudo tee -a /etc/apt/sources.list.d/grafana.list

#refresh and update apt-get

sudo apt-get update -y

#Install Grafana

sudo apt-get install grafana -y

#Check Grafana version for successfull installation
grafana-server -v

#start grafana service
sudo systemctl start grafana-server

#Add auto start grafana
sudo systemctl enable grafana-server


#Check grafana service status
systemctl status grafana-server


#Check grafana running port

ss -antpl | grep 3000


#Install ngix to Add reverse proxy

sudo apt-get install nginx -y


#Add ngix config to redirect port 4

sudo nano /etc/nginx/conf.d/grafana.conf

server {
        server_name enter-your-ec2-dnsnamehere;
        listen 80 ;
        access_log /var/log/nginx/grafana.log;

    location / {
                proxy_pass http://localhost:3000;
        proxy_set_header Host $http_host;
                proxy_set_header X-Forwarded-Host $host:$server_port;
                proxy_set_header X-Forwarded-Server $host;
                proxy_set_header X-Forwarded-For $proxy_add_x_forwarded_for;
        }
}


# increase bucket size to avoid long host name error

sudo nano /etc/nginx/nginx.conf

server_names_hash_bucket_size to 128;


#Test ngix
sudo nginx -t

#restart ngix
sudo systemctl restart nginx

Now access the server from public with admin / admin